


It is hard to overstate just how clear the evidence is for the claim that racial inequality is an ongoing problem in the United States. There are many studies documenting the disparities that exist between Blacks and whites in the United States. The following is a list of evidence for the claim that racial inequality is an ongoing problem in the United States. This list is a “living document” that will be regularly updated to incorporate new scientific data as it comes in (or as I become aware of it). Please use this resource to make evidence-based contributions to discussions about racial inequality in the United States.
Also, use the button on the right side of the screen to subscribe to my blog to get notified of my upcoming articles on the causes of racial inequality in the United States. There are compelling scientific reasons to see that racial inequality today is linked to past inequality. There is also compelling evidence from experimental research that current discrimination plays a role in current racial inequality.
___________________________________________________________________________________________________________________
Black and white disparities
Income, wealth, and jobs
- 18.7% (see table 2 here in 2019) of Black Americans live in poverty, compared to 7.3% of white Americans.
- 32% of Black American children live in poverty, compared to 11% of white American children.
- 19.1% of Black households have an inability to obtain adequate nutritious food, compared to 7.9% of white households (as of 2019).
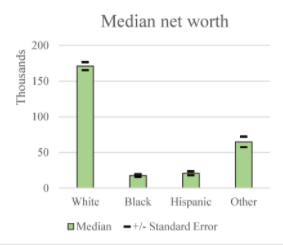
- Black households have about 10% of the median net worth compared to their white counterparts (as of 2016).
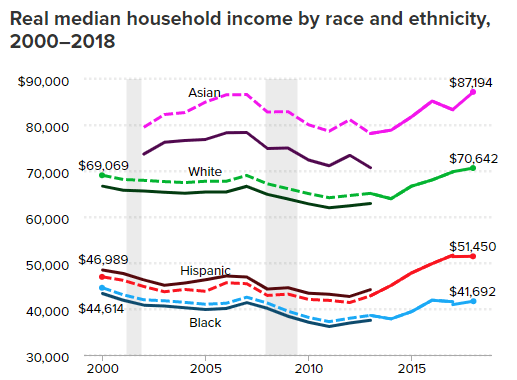
- Black household median annual income is nearly half that of white households (as of 2018).
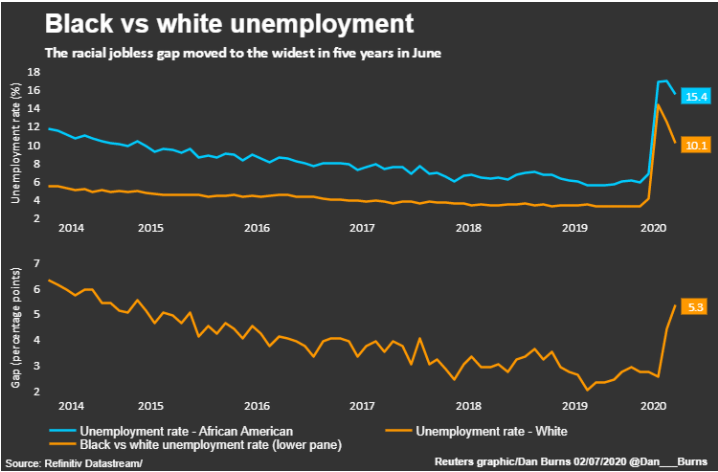
- 15.4% of Black Americans are unemployed, compared to 10.1% white Americans (as of 2020).
- 1% of fortune 500 company CEOs are Black, despite Black people making up 13% of the American population (as of 2020).
- 36% of blacks have money in the stock market, compared to 60% of whites (as of 2017).
- Typical Black households have 46% of the retirement wealth of typical white households (as of 2016).
Housing
- 47% of Black families own a home, compared to 76% of white families (as of 2nd quarter 2020).
- 20% of black households are extremely low-income renters, compared to 6% of whites (as of 2019).
- 40% of the homeless population is Black, despite only representing 13 percent of the general population (as of 2019).
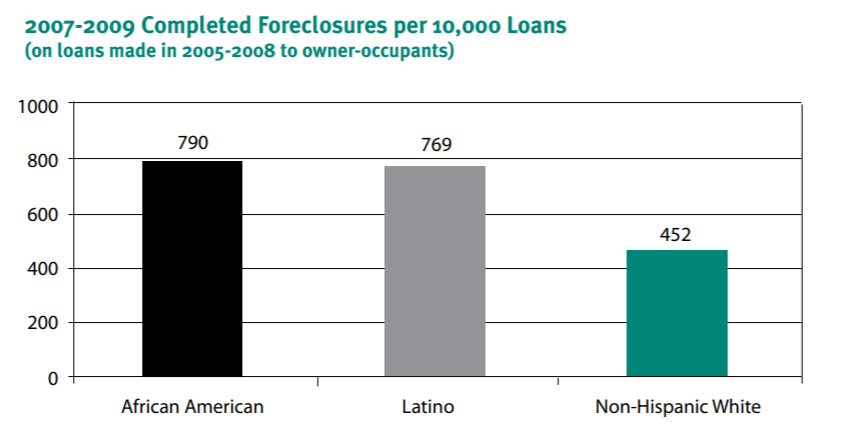
- 790 in 10,000 loans for black households were foreclosed upon, while only 452 in 10,000 loans for non-Hispanic white households were foreclosed upon (between 2005-2008).
Education
- 80% of K-12 educators are white, while only 6.3% are Black.
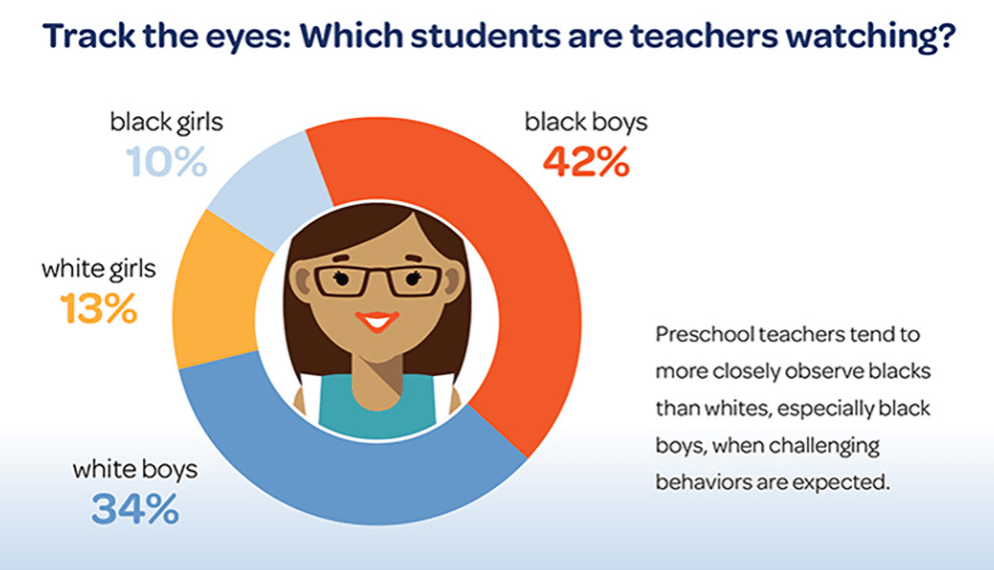
- In a 2016 study, Black and white teachers were asked to identify problematic behaviors in a group of children (there were in fact no problematic behaviors in the video). Eye-tracking methods showed that they excessively monitored the black boy in the video.
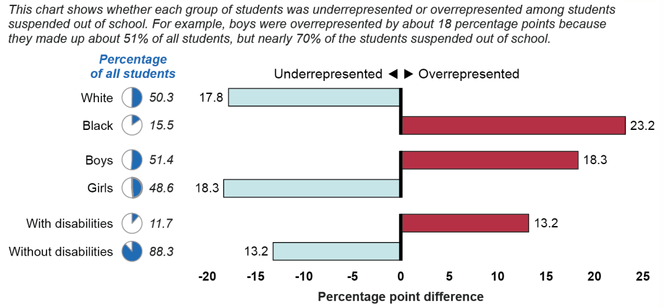
- Black children are disproportionately punished at schools, a disparity that exists regardless of the type of disciplinary action, level of school poverty, or type of school attended.
- 64% of Black American children attend low income (i.e. Title 1) schools, compared to 33% of white American children.
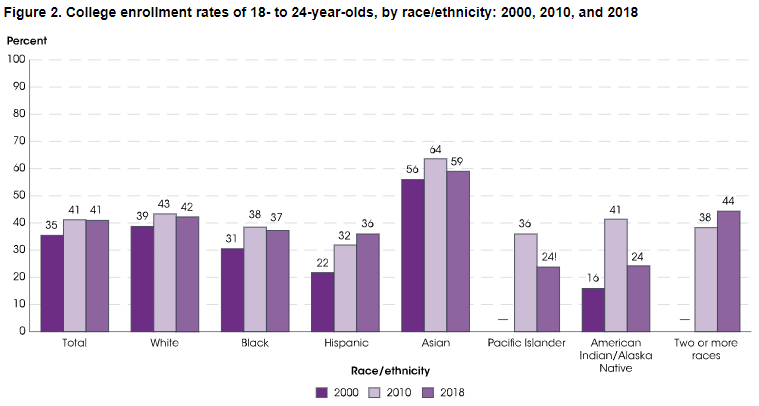
- 37% of Black Americans age 18 – 24 enrolled in college in 2018, compared to 42% of whites
- 22.8% of Black Americans age 25 – 29 graduate from college, compared to 42.1% of white Americans (as of 2017).
- 42% of Black college students are first generation (i.e. parents didn’t attend or graduate from college), compared to only 28% of white students (as of 2012).
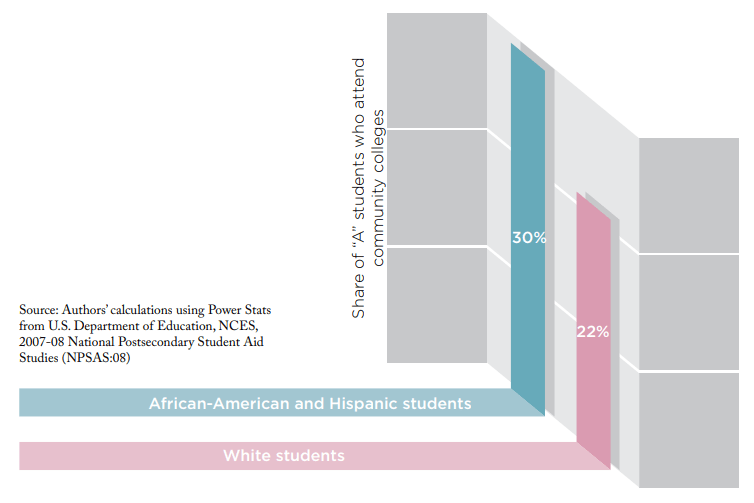
- 30% of Black and Hispanic students with 3.5 or higher high school GPAs attend community colleges, compared to 22% of white students (as of 2009).
- 72% of Black students go into debt to pay for their education, compared to 56% of white students (as of 2016).
- 5% of professors, associated professors, assistance professors, instructors, lecturers, or other faculty are black compared to 70% that are white (as of 2017).
Policing
Something to note about police statistics, is there is often not national data that can be used to understand racial disparities. Instead, specific police departments share data with a specific group of researchers. Thus many of the data points below are not taken from the US as a whole.
- Black people are killed by police disproportionately at a yearly rate that is more than twice that of white people.
- Over the course of their life, 1 out of every 1000 Black men are killed by police, a rate that is 2.5 times higher than for white men.
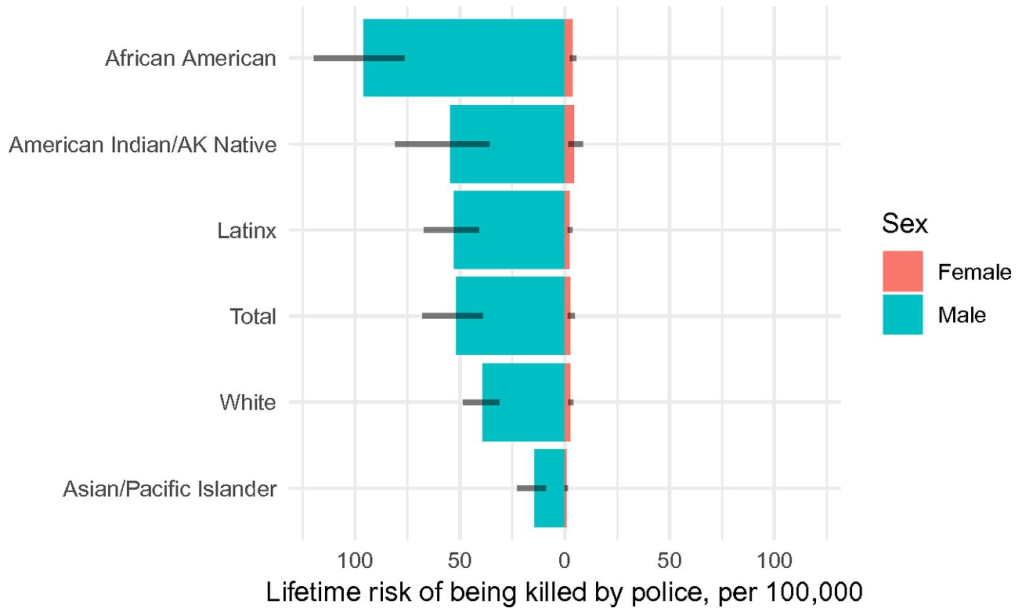
- Unarmed Black people are killed by police disproportionately.
- The likelihood of incarceration was higher for Black people at every level of wealth compared to the white likelihood.
- Black and white Americans sell and use drugs at similar rates, but Black Americans are 2.7 times more likely to be arrested for drug-related offenses (as of 2015).

- A 2017 study of 20,000,000 traffic stops in North Carolina revealed that Black drivers are 95% more likely to be stopped (after controlling for amount of driving), and when stopped are 115% more likely to be searched.
- A 2017 study of 4.5 million police stops in North Carolina revealed that blacks are more likely to be searched in comparison to whites even when controlling for the rates of carrying contraband.
- Minneapolis police use force against black people at 7 times the rate of whites between 2015 and 2020.
- Black Americans (from nationally representative data) are 1.7 times more likely to be arrested over a misdemeanor than whites, a trend that is remarkably consistent from 1980 until 2015.
- Black Americans (from a national study) were the targets of 39% of SWAT deployments in comparison to whites only making 20% (numbers disproportional to their population).
- Wrongful conviction data based on the National Registry of Exonerations as of 2017.
- Based on exonerations, innocent black people are 7 times more likely to be convicted of murder than innocent white people.
- African-American prisoners who are convicted of murder are 50% more likely to be innocent than other convicted murderers.
- African Americans imprisoned for murder are more likely to be innocent if they were convicted of killing white victims.
- The convictions that led to murder exonerations with black defendants were 22% more likely to include misconduct by police officers than those with white defendants.
- On average black murder exonerees spent three years longer in prison before release than white murder exonerees, and those sentenced to death spent four years longer.
- Prosecution and sentencing in NYC from 2010-2011
- Blacks were 10% more likely to be detained before their trial compared to whites, while controlling for other factors, including charge seriousness and prior record.
- Blacks were 20% more likely to be detained before a misdemeanor trial compared to whites.
- Blacks were 9% more likely to have their cases dismissed compared to whites.
- For Blacks sentenced for misdemeanors, they are 47% more likely to received custodial offers (i.e. serving reduced time or time-served in pre-trial) as opposed to non-custodial sentences (i.e. community service, probation, and fines) compared to whites.
- Blacks were 5% more likely (compared to whites) to be sentenced to prison, after controlling for a range of factors. This can be broken down further into the following:
- 15% more likely for misdemeanor person offenses.
- 15% more likely for misdemeanor drug offenses.
- 14% more likely for felony drug offenses.
- In a 2011 study of 5 counties in Texas, California, Florida, and Illinois, Black Americans were held at a higher bail compared to whites, even after controlling for failure to appear in court.
- In a 2014 study of 4 counties in Texas, Iowa, New York, and Oregon, Black probationers had higher odds (18 – 39%) of having their probation revoked, even after controlling for available factors (such as crime severity, criminal history, drug/alcohol problems, risk assessment scores, etc.).
- A 2016 report shows that 45% of prisoners in solitary confinement (i.e. restricted housing) are black despite making 40% of the prison population.
- Using data from 1973 until 2019, defendants were 17 times more likely to receive the death penalty when they are convicted of killing a white victim than when convicted of killing a black victim.
- Black people are 5% more likely to receive the death sentence after controlling for culpability (as of 1998).
- 1,730 per 100,000 (about 1.7%) Black Americans are incarcerated, compared to 270 per 100,000 (about .3%) white Americans. For reference, Blacks make up about 13.4% of the population, compared to 76.3% of the population
Healthcare
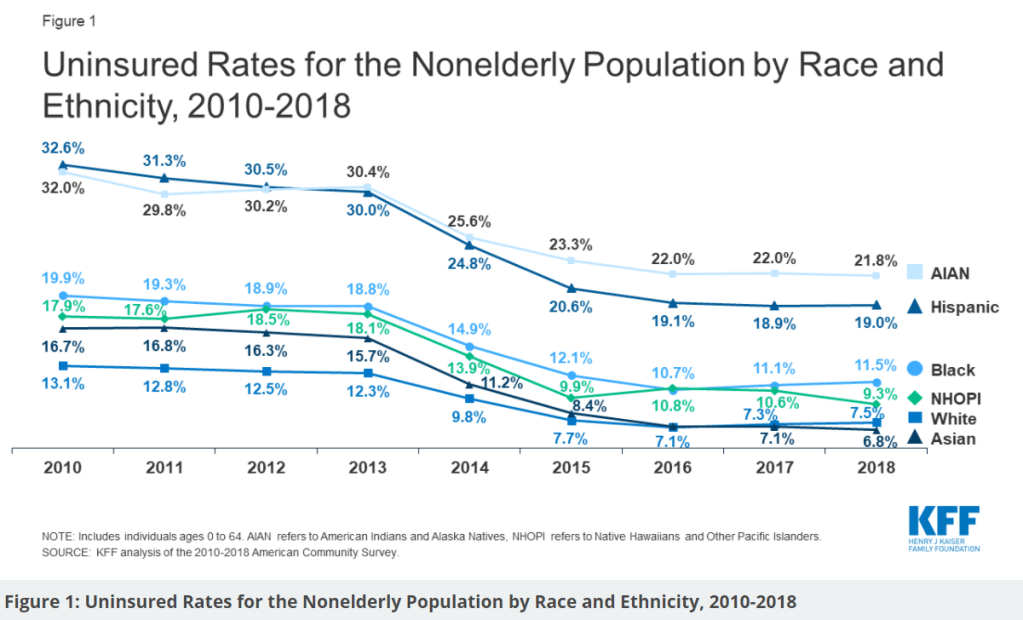
- In 2013, 18.8% of (nonelderly) Black Americans were uninsured while 12.3% of white Americans were. In the years since the ACA was implemented, this gap has closed a bit such that in 2019, 11.5% of Black and 7.5% of white Americans were uninsured.
- 11.4 per 1,000 Black American infants die in childbirth, compared to 4.9 per 1,000 white American infants (as of 2015).
- The likelihood of a Black mother dying during childbirth is 4-5 times higher than for white women (as of 2016).
- Racial/ethnic minorities are 1.5 – 2 times more likely than whites to have most of the major chronic diseases.
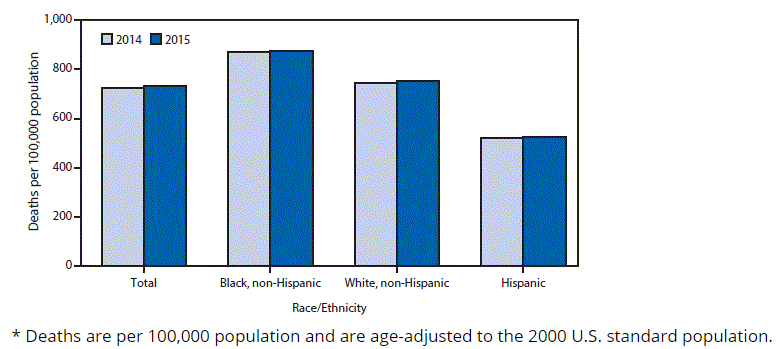
- Age-adjusted death rate for non-Hispanic Black Americans is 876.1 per 100,000 compared to 753.2 per 100,000 for non-Hispanic white Americans as of 2015.
- Black mortality rate in 2015 is 16% higher than white mortality rate (a drop from 33% in 1999).
- Black mortality rate for people under 65 is 40% higher than the white mortality rate.
- Black American life expectancy is 75.5 years compared to 78.9 years for white Americans as of 2015.
- Racial health disparities accounted for over $1 trillion (in 2008 dollars) in direct and indirect costs for the years 2003-2006.
- Black people breathe 66% more air pollution from vehicles than white residents (as of 2019).
- Black children have lead poisoning levels 2-6 times higher than white children (as of 2010).
- Black women of reproductive age have nearly 3 times the level of cadmium poisoning compared to their white counterparts (after controlling for other variables; as of 2006).
Democratic influence
- Black people are underrepresented as elected Sheriffs; 5% of the nations Sheriffs are Black (as of 2020).
- Black people are underrepresented in state legislatures; 9% of state legislatures are Black (as of 2016).
- There are no Black governors in the US as of 2020. There have only been 4 Black governors in the history of the country.
- Residents of Black neighborhoods wait far longer to vote in comparison to residents of White neighborhoods (in 2016 election).
- Black voters in Florida and Georgia who voted by mail were twice as likely to have their ballots reject compared to white voters.
- There has always been a midterm voting gap between Black and white eligible voters that has narrowed, but never closed.
- Polling places in Maryland, Florida, and South Carolina serving large minority communities tend to have less polling machines.
- A hopeful sign: In 2020, for the first time in US history, the US house of representatives has Black representation that matches their population.
Originally posted 9/17/2020 and last updated 1/21/2021
